1 Introduction to the World
1.1 Geography Basics
Learning Objectives:
- Understand the focus of geography and the two main branches of the discipline.
- Learn about the tools geographers use to study the earth’s surface.
- Utilize the grid system of latitude and longitude to define locations and explain how it relates to seasons and time zones.
- Distinguish between the different types of regional distinctions recognized in geography.
- Understand the spatial nature of geography and how each place or region is examined, analyzed, and compared with other places or regions.
- Identify the basic geographic realms and their locations.
A. What is Geography?
Geography (from the Greek geo, which means “Earth,” and graphein, which means “to write”) is the spatial study of the earth’s surface. Geographers study the earth’s physical characteristics, its inhabitants and cultures, phenomena such as climate, and the earth’s place within the universe. Geographers examine the spatial relationships between all physical and cultural phenomena in the world, since what happens in one place affects other places and people. Geographers also look at how the earth, its climate, and its landscapes are changing due to cultural intervention.
Geography is a much broader field than many people realize. Most people think of area studies as the whole of geography. Some think it is simply memorizing lists of places and their locations. In reality, geography is the study of the entire earth, including how human activity has changed it. Physical geography involves all the planet’s physical systems. Human geography incorporates studies of human culture, spatial relationships, interactions between humans and the environment, and many other areas of research that involve the different subspecialties of geography.
The discipline of geography bridges the social sciences with the physical sciences and can provide a framework for understanding our world. By studying geography, we can begin to understand the relationships and common factors that tie our human community together and link us to the natural environment. For instance, as a result of the rapid transfer of information and technology and the growth of modes of transportation and communication, the world is undergoing globalization on a massive scale. Globalization refers to the spread of ideas and information worldwide, making distant places become more and more similar. A common example is fast food restaurants, such as McDonald’s, Pizza Hut, and Kentucky Fried Chicken, which are now found in countries around the world, creating a more homogeneous culinary landscape. Some are concerned that globalization is creating a uniform landscape around the world, often at the expense of local culture. The more we understand our world, the better prepared we will be to address issues such as this.
There are many approaches to studying world geography. A systematic approach focuses on studying one topic at a time, such as population, and looking at the worldwide patterns of that phenomenon before moving on to another topic. This textbook takes a regional approach, in which one region at a time is studied in its entirety, describing its landforms, climate, population, languages, religions, natural resources, political geography, and so on. This book also focuses on themes that illustrate the globalization process, in order to help you better understand your global community and its current affairs.
B. Thinking Geographically
Geography helps us make sense of the world through four historical traditions:
- Spatial analysis
- Earth science
- Area (or regional) studies
- Human-environment interaction
Spatial analysis involves analyzing where phenomena are located on the surface of the earth, as well as where they are located relative to other phenomena. For example, a geographer might use maps of climates and population to discover which types of climates are home to the most people. Earth science includes the study of landforms, climates, and the distribution of plants and animals. Area or regional studies focuses on a particular region to understand the dynamics of a specific interaction between human activity and the landscape. Researchers studying human-environment interaction examine the impact of humans on the natural landscape and find out how different cultures have used and changed their environments.
Geography provides the tools to integrate knowledge from many disciplines into a usable form by providing a sense of place to natural or human events. You will find that geography often explains why or how something occurs in a specific location. World geography utilizes the spatial approach to help understand the components of our global community.
When thinking geographically, geographers try to answer three fundamental questions:
- Where are things located?
- Why are they located where they are?
- What difference does this make (how does it affect us)?
C. Branches of Geography
The discipline of geography can be broken down into two main branches: physical geography and human geography. These two main areas are similar in that they both use a spatial perspective, and they both include the study of place and the comparison of one place with another. Each branch, though, focuses on different aspects of the world.
Physical geography is the spatial study of natural phenomena that make up the environment, such as rivers, mountains, landforms, weather, climate, soils, plants, and any other physical aspects of the earth’s surface. Physical geography focuses on geography as a form of earth science. It tends to emphasize the main physical parts of the earth—the lithosphere (surface of the earth’s crust), the atmosphere (air), the hydrosphere (water), and the biosphere (living organisms)—and the relationships between these parts. Each of these four spheres is the focus of study of one of the major subfields within physical geography:
- Geomorphology (the study of the earth’s surface features)
- Climatology (the study of climate and climate change)
- Hydrography (the study of water resources and their distribution)
- Biogeography (the study of the geographic patterns of species distribution)
Some physical geographers study the earth’s place in the solar system. Others are environmental geographers, part of an emerging field that studies the spatial aspects and cultural perceptions of the natural environment. Environmental geography requires an understanding of both physical and human geography, as well as an understanding of how humans conceptualize their environment and the physical landscape.
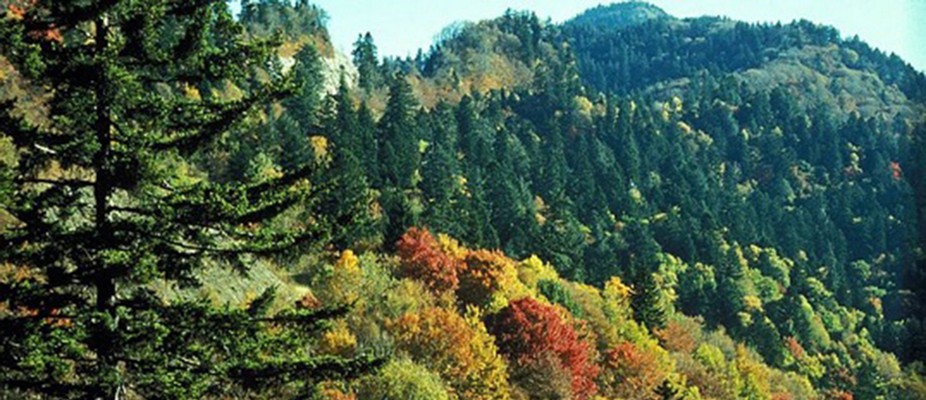
Physical landscape is the term used to describe the natural terrain at any one place on the planet. The natural forces of erosion, weather, tectonic plate action, and water have formed the earth’s physical features. Many U.S. state and national parks, such as Yellowstone, Yosemite, and the Grand Canyon, attempt to preserve unique physical landscapes for the public to enjoy.
Human geography is the study of human activity and its relationship to the earth’s surface. Human geographers examine the distribution of human populations, religions, languages, ethnicities, political systems, economics, urban dynamics, and other components of human activity. They study patterns of interaction between human cultures and various environments and focus on the causes and consequences of human settlement and distribution over the landscape. While the economic and cultural aspects of humanity are primary focuses of human geography, these aspects cannot be understood without describing the physical landscape on which economic and cultural activities take place.
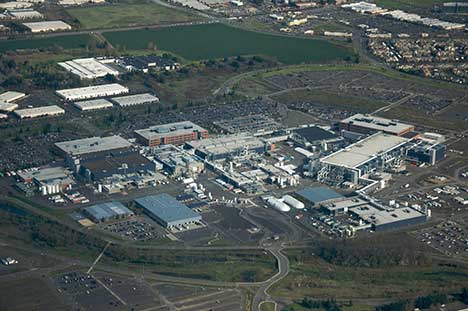
The cultural landscape is the term used to describe those parts of the earth’s surface that have been altered or created by humans. For example, the urban cultural landscape of a city may include buildings, streets, signs, parking lots, or vehicles, while the rural cultural landscape may include fields, orchards, fences, barns, or farmsteads. Cultural forces unique to a given place—such as religion, language, ethnicity, customs, or heritage—influence the cultural landscape of that place at a given time.

D. Tools of Geography
Geospatial techniques are tools used by geographers to illustrate, manage, and manipulate spatial data. Because maps are powerful graphic tools that allow us to illustrate relationships and processes at work in the world, cartography and geographic information systems have become important in modern sciences. Cartography is the art and science of making maps, which illustrate data in a spatial form and are invaluable in understanding what is happening at a given place at a given time.
Making maps and verifying a location have become more exact with the development of the global positioning system (GPS). A GPS unit can receive signals from orbiting satellites and calculate an exact location in latitude and longitude, which is helpful for determining where one is located on the earth or for verifying a point on a map. GPS units are standard equipment for many transportation systems and have found their way into products such as cell phones, handheld computers, fish finders, and other mobile equipment. GPS technology is widely implemented in the transport of people, goods, and services around the world.
Remote sensing technology acquires data about the earth’s surface through aerial photographs taken from airplanes or images captured by satellites orbiting the earth. Remotely sensed images allow geographers to identify, understand, or explain a particular landscape or determine the land use of a place. These images can serve as important components in the cartographic (map-making) process. These technologies provide the means to examine and analyze changes on the earth’s surface caused by natural or human forces. Google Earth is an excellent example of a computer tool that illustrates remotely sensed images of locations on the earth.
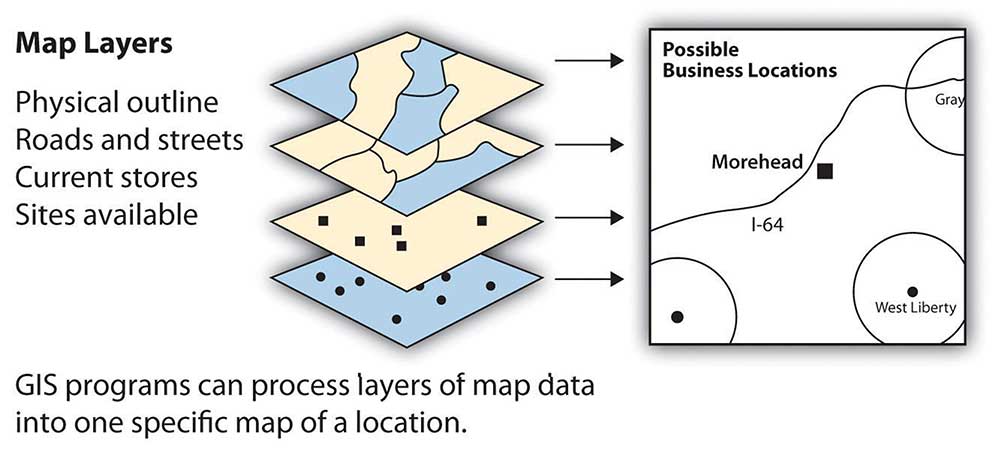
Geographic information systems (GIS) use a computer program to assimilate and manage many layers of map data, which then provide specific information about a given place. GIS data are usually in digital form and arranged in layers. The GIS computer program can sort or analyze layers of data to illustrate a specific feature or activity. GIS programs are used in a wide range of applications, from determining the habitat range of a particular species of bird to mapping the hometowns of university students.
GIS specialists often create and analyze geographical information for government agencies or private businesses. They use computer programs to take raw data to develop the information these organizations need for making vital decisions. For example, in business applications, GIS can be used to determine a favorable location for a retail store based on the analysis of spatial data layers such as population distribution, highway or street arrangements, and the locations of similar stores or competitive establishments. GIS can integrate a number of maps into one to help analysts understand a place in relation to their own specific needs.
GIS has revolutionized the field of cartography: nearly all cartography is now done with the assistance of GIS software. Additionally, analysis of various cultural and natural phenomena through the use of GIS software and specialized maps is an important part of urban planning and other social and physical sciences. Students interested in a career in geography are well served to learn geospatial techniques and gain skills and experience in GIS and remote sensing, as they are the areas within geography where employment opportunities have grown the most over the past few decades.
E. Absolute and Relative Location
When identifying a region or place on the earth, the first step is to understand its relative and absolute location. Relative location describes a location on the earth’s surface with reference to other places, taking into consideration features such as transportation access or terrain. For example, Salem, Oregon is located about an hour south of Portland along the Willamette River, and is between the Coast Range to the west and the Cascade Range to the east.
Absolute location, on the other hand, describes a location on the earth’s surface using some kind of coordinate system, such as a street address or latitude and longitude. Absolute location is vital to the cartographic process and to human activities that require an agreed-upon method of identifying a place or point.
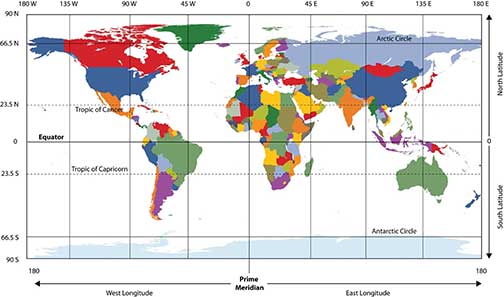
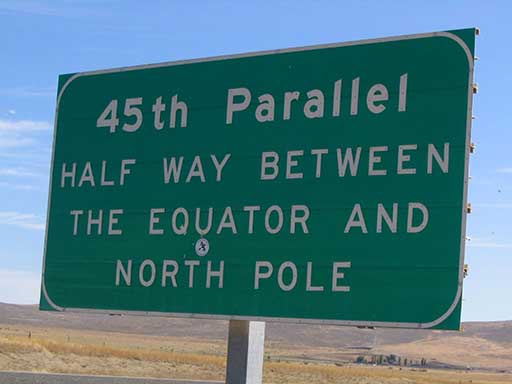
Geographers and cartographers organize locations on the earth using a series of imaginary lines that encircle the globe. Lines of latitude and longitude allow any location on the earth to have an identifiable address of degrees north or south and east or west. For example, Salem, Oregon is located at 45°N 123°W. This means it is 45 degrees north of the equator, and 123 degrees west of the prime meridian.
F. Latitude and Longitude
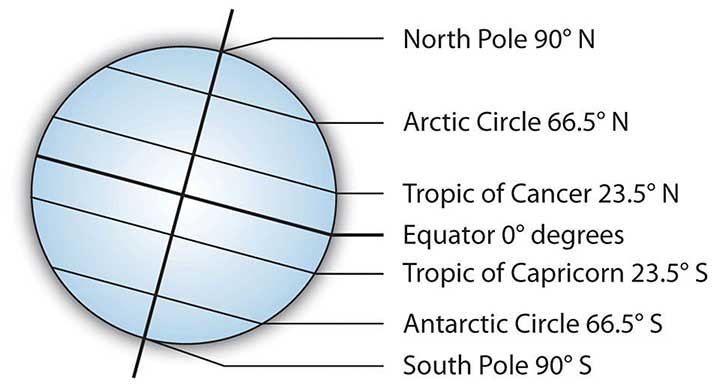
The equator is the largest circle of latitude on Earth. The equator divides the earth into the Northern and Southern Hemispheres and is located at 0 degrees latitude. The other lines of latitude are numbered from 0 to 90 degrees going toward each of the poles. The lines north of the equator toward the North Pole are north latitude, and each of the numbers is followed by the letter “N.” The lines south of the equator toward the South Pole are south latitude, and each of the numbers is followed by the letter “S.” The equator (0° latitude) is the only line of latitude without any letter following the number. Notice that all lines of latitude are parallel to the equator (they are often called parallels) and that the North Pole equals 90 degrees N and the South Pole equals 90 degrees S. Noted parallels include both the Tropic of Cancer and the Tropic of Capricorn, which are 23.5 degrees from the equator. At 66.5 degrees from the equator are the Arctic Circle and the Antarctic Circle near the North and South Pole, respectively.
The prime meridian sits at 0 degrees longitude and divides the earth into the Eastern and Western Hemispheres. The prime meridian is defined as an imaginary line that runs through the Royal Observatory in Greenwich, England, a suburb of London, and in fact it is often referred to as the Greenwich meridian. The Eastern Hemisphere includes the continents of Europe, Asia, and Australia, while the Western Hemisphere includes North and South America. All meridians (lines of longitude) east of the prime meridian are numbered from 1 to 179 degrees east (E); the lines west of the prime meridian are numbered from 1 to 179 degrees west (W). The 0 and 180 lines do not have a letter attached to them. The International Date Line (located at or near 180 degrees longitude) is opposite the prime meridian. Each day officially starts at 12:00 a.m., at the International Date Line. The International Date Line does not follow the 180-degree meridian exactly. A number of alterations have been made to the International Date Line to accommodate political agreements to include an island or country on one side of the line or another.
G. Climate and Latitude
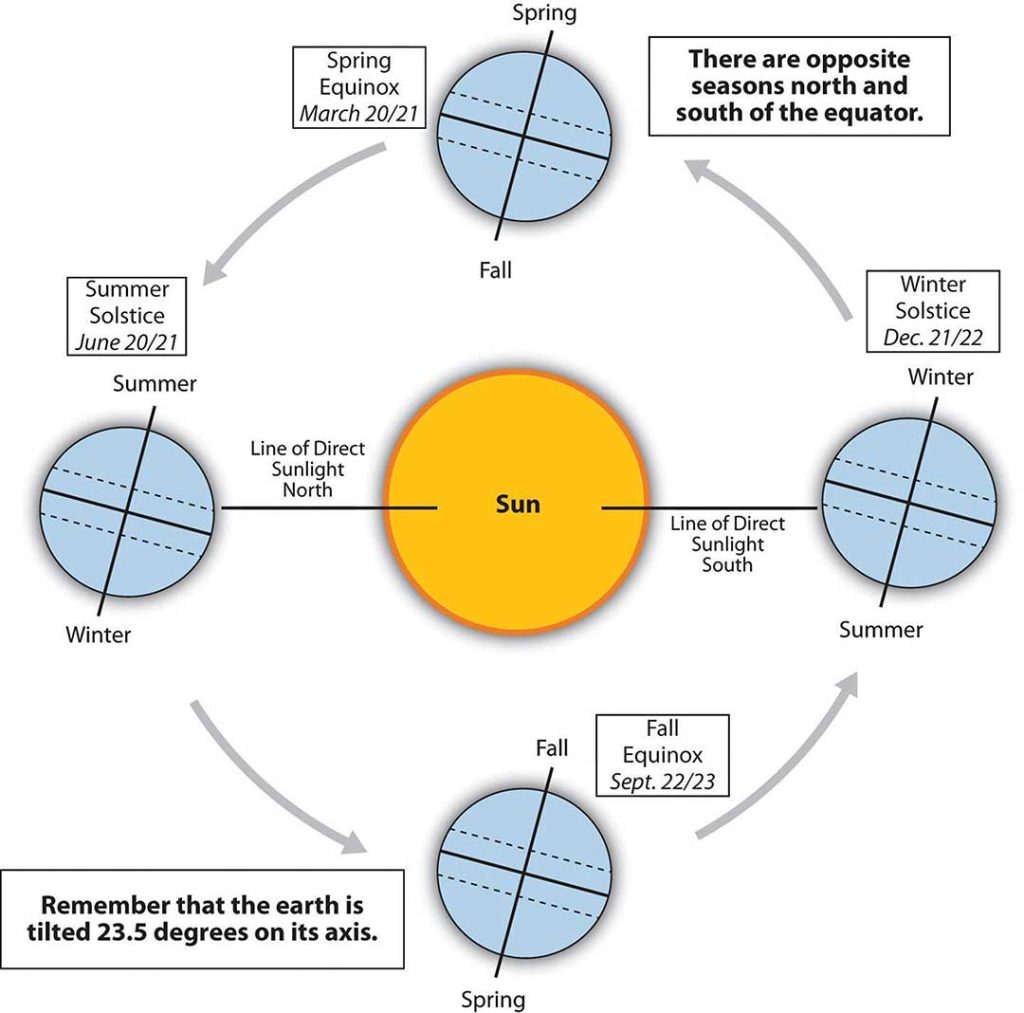
The earth is tilted on its axis 23.5 degrees from vertical. As it rotates around the sun, the tilt of the earth’s axis provides different climatic seasons because of the variations in the angle of direct sunlight on the planet. Places receiving more direct sunlight, such as near the equator, experience a warmer climate. Near the poles, the lower angle of incoming solar radiation results in more reflected sunlight and thus a cooler climate. The Northern Hemisphere experiences summer when the Northern Hemisphere is tilted toward the sun, and winter when it is tilted away from the sun. Seasons in the Southern Hemisphere are the opposite of the Northern Hemisphere, since when the Northern Hemisphere is tilted toward the sun, the Southern Hemisphere is tilted away from the sun, and vice versa.
The Tropic of Cancer is the parallel at 23.5 degrees north of the equator, which is the most northerly place on Earth to receive direct vertical rays of sunlight (on or about June 21). The Tropic of Capricorn is the parallel at 23.5 degrees south of the equator and is the most southerly location on Earth to receive direct vertical rays of sunlight (on or about December 21).
The region between the Tropics of Cancer and Capricorn is known as the tropics. This area does not experience dramatic seasonal changes because the amount of direct sunlight received does not vary widely. The higher latitudes (north of the Tropic of Cancer and south of the Tropic of Capricorn) experience significant seasonal variation in climate.
The Arctic Circle is the line of latitude at 66.5 degrees north. During winter, the North Pole is tilted away from the sun and does not receive much sunlight. At times, it is dark for all or most of the twenty-four-hour day. During the Northern Hemisphere’s summer, the North Pole faces more toward the sun and receives sunlight for long portions of the day.
The Antarctic Circle is the corresponding line of latitude at 66.5 degrees south. When it is winter in the north, it is summer in the south.
The Arctic and Antarctic Circles mark the extremities (southern and northern, respectively) of the polar day (twenty-four-hour sunlit day) and the polar night (twenty-four-hour sunless night). North of the Arctic Circle, the sun is above the horizon for twenty-four continuous hours at least once per year and below the horizon for twenty-four continuous hours at least once per year. This is true also near the Antarctic Circle, but it occurs south of the Antarctic Circle, toward the South Pole. Equinoxes, when the line of direct sunlight hits the equator and days and nights are of equal length, occur in the spring and fall on or around March 21 and September 22.
H. Regions in Geography
A region is a basic unit of study in geography—a unit of space characterized by a feature such as a common government, language, political situation, or landform. A region can be a country governed by political boundaries, such as France or Canada; a region can be defined by a landform, such as the drainage basin of all the water that flows into the Mississippi River; and a region can even be defined by the area served by a shopping mall. Cultural regions can be defined by similarities in human activities, traditions, or cultural attributes such as language or religion.
There are three basic types of regions: formal, functional, and vernacular. Formal regions (also sometimes called uniform regions) are usually precisely defined and are rather objective, with easily recognized boundaries. Examples include political units, such as counties, states, provinces, or countries. Physical regions are often formal regions, including landform regions, such as the Rocky Mountains or Great Plains, climate regions, or vegetation regions. Cultural regions can also often have formal boundaries, including language regions, religious regions, or areas dominated by certain ethnic groups.
Physical geographic features have a huge influence on where political boundaries of formal regions are set. If you look at a world map, you will recognize that many political boundaries are natural features, such as rivers, mountain ranges, and large lakes. For example, between the United States and Mexico, the Rio Grande makes up a portion of the border. Likewise, between Canada and the United States, a major part of the eastern border is along the Saint Lawrence Seaway and the Great Lakes. Alpine mountain ranges in Europe create borders, such as the boundary between Switzerland and Italy.
While geographic features can serve as convenient formal borders, political disputes will often flare up in adjacent areas, particularly if valuable natural or cultural resources are found within the geographic features. Oil drilling near the coast of a sovereign country, for example, can cause a dispute between countries about which one has dominion over the oil resources. The exploitation of offshore fisheries can also be disputed.
Functional regions have boundaries related to a practical function within a given area. For example, a functional region can be defined by a newspaper service or delivery area. If the newspaper goes bankrupt, the functional region no longer exists. Church parishes, shopping malls, a city and its suburbs, and business service areas are other examples of functional regions. They function to serve a region and may have established boundaries for limits of the area to which they will provide service. An example of a common service area—that is, a functional region—is the region to which a local pizza shop will deliver.
Vernacular regions have loosely defined boundaries based on people’s perceptions or thoughts. Because of this, they are sometimes referred to as popular or perceptual regions. Vernacular regions are subjective—that is, different people may have different opinions about the limits of the regions. Vernacular regions include concepts such as the region called the “Middle East.” Many people have a rough idea of the Middle East’s location but do not know precisely which countries make up the Middle East. Also, in the United States, the terms Pacific Northwest, Midwest, or South have many variations. Each individual might have a different idea about the location of the boundaries of these regions. Whether the state of Kentucky belongs in the Midwest or in the South might be a matter of individual perception. Similarly, various regions of the United States have been referred to as the Rust Belt, Sun Belt, or Bible Belt without a clear definition of their boundaries. The limit of a vernacular area is more a matter of perception than of any formally agreed-upon criteria. Nevertheless, most people would recognize the general area being discussed when using one of the vernacular terms in a conversation.
I. World Regional Geography
World regional geography studies various world regions as they compare with the rest of the world. Factors for comparison include both the physical and the cultural landscape. Major questions include: Who lives there? What are their lives like? What do they do for a living? Physical factors of significance can include location, climate type, vegetation, and terrain. Human factors include cultural traditions, ethnicity, language, religion, economics, and politics.
World regional geography focuses on regions of various sizes across the earth’s landscape and aspires to understand the unique character of regions in terms of their natural and cultural attributes. This textbook takes a regional approach with a focus on themes that illustrate the globalization process, which in turn helps us better understand our global community.
The regions studied in world regional geography can be combined into larger portions called realms. Realms are large areas of the planet, usually with multiple regions, that share the same general geographic location. Regions are cohesive areas within each realm. This textbook divides the world into the following twelve realms:
- Europe
- Russia
- North America
- Australia and New Zealand
- The Pacific and Antarctica
- Middle America
- South America
- Sub-Saharan Africa
- North Africa and Southwest Asia
- South Asia
- East Asia
- Southeast Asia
Key Takeaways
- Geography is the spatial study of the earth’s surface. The discipline of geography bridges the social sciences with the physical sciences. The two main branches of geography include physical geography and human geography. GIS, GPS, and remote sensing are tools that geographers use to study the spatial nature of physical and human landscapes.
- A grid system divides the earth by lines of latitude and longitude that allow for the identification of absolute location on the earth’s surface through coordinates measured in degrees. There are twenty-four time zones that are each roughly 15 degrees wide and organize time intervals around the world.
- The tilt of the earth’s axis at 23.5 degrees helps create the earth’s seasonal variations. For example, the northern hemisphere exper-iences summer when it is tilted toward the sun, and winter when it is tilted away from the sun. The line of direct sunlight always hits the earth between 23.5 degrees north (the Tropic of Cancer, about June 21) and 23.5 degrees south (the Tropic of Capricorn, about December 21).
- A region (or realm) is the basic unit of study in geography. There are three main types of regions: formal, functional, and vernacular. World regional geography is the study of the world realm by realm.
1.2 The Environment and Human Activity
Learning Objectives
- Explain how climate and human habitation are related and distinguish between the main climate types.
- Explain the dynamics of tectonic plates and their relationship to earthquakes and volcanic activity.
- Outline the main causes of and problems with deforestation. Explain the relationship between deforestation and climate change.
- Point out where the rain shadow effect takes place and explain why it occurs in those places and how it may influence human activity.
- Understand how climate change occurs and the relationship between greenhouse gasses such as carbon dioxide and the planet’s temperature regulation.
A. Climate and Human Habitation
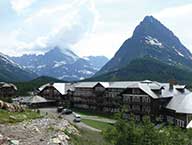
The earth’s ability to receive and absorb sunlight is a primary factor in the earth’s environment, and it also has a big impact on human populations. There are no large cities or human communities in Antarctica because it is so cold; most of the sunlight filtering down to Antarctica is reflected off the earth at that latitude because of the tilt of the earth’s axis and the resulting low angle of incoming solar radiation. Answering the basic questions of where most humans live on Earth and why they live there depends on understanding climate. Temperate midlatitude climates usually provide the greatest opportunities for human habitation.
Since the region between the Tropic of Cancer and the Tropic of Capricorn receives the most direct sunlight throughout the year, it is favorable to plant and animal life, provided there is adequate moisture or precipitation. Humans have been living in the tropics for a long time, even when the ice sheets were covering parts of the midlatitudes. The problem with the tropics is that the soils are usually of poor quality and the nutrients have been leached out. Leaching is a process in which nutrients in the soil dissolve in water and are carried below the root zone of a crop as the water percolates downward.
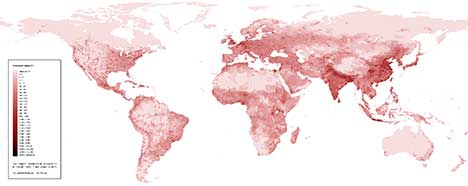
Today, when we look at the earth and the distribution of human population, two main factors attract human habitation: moderate climates and access to water. More than 70 percent of the earth’s surface is covered with water. The problem is that less than 3 percent of the water is fresh, and most of that fresh water is stored in ice caps near the North or South Pole. This leaves less than 1 percent of the world’s fresh water for human use, usually in lakes, rivers, streams, or groundwater and underground aquifers. Climate plays an important role in where humans live because precipitation is necessary for growing crops, raising livestock, and supplying fresh water to urban communities.
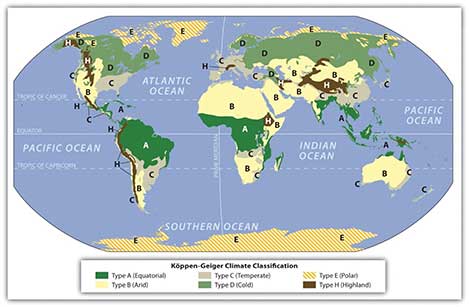
Geographers have developed various classification systems to identify climate types. Climate refers to the long-term average weather conditions in a particular region of the world. Weather refers to the atmospheric conditions at a given time and place. In other words, “Climate is what you expect, but weather is what you get!” The two main elements in describing both weather and climate are temperature and precipitation. For the purposes of this overview of world geography, the various climate types have been broken down into six basic types—A, B, C, D, E, and H—after the Köppen-Geiger classification system.
- Type A: Tropical or equatorial climates
- Type B: Dry (arid) climates
- Type C: Moderate or temperate (mild midlatitude)climates
- Type D: Cold or continental (severe midlatitude)climates
- Type E: Polar or extreme climates
- Type H: (Unclassified) highland climates
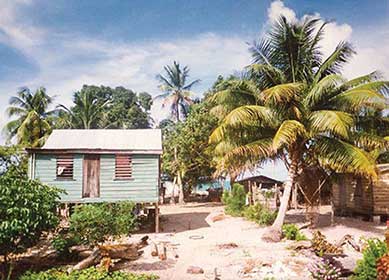
Type A: Tropical or Equatorial Climates
The humid tropical type A climates have warm temperatures year round (every month averages at least 64 degrees F), with a high level of precipitation, typically in the form of rain. Type A climates have various subgroups that indicate how the rainfall is distributed throughout the year. There are three specific A climates. Two of them (tropical monsoon and tropical savanna) have a dry season and a wet season, while the other (tropical rain forest) receives abundant rainfall throughout the year.
Type B: Dry (Arid) Climates
There are two types of Type B climates: desert and steppe (semi-desert). Deserts are defined by aridity and average less than about 10 to 15 inches of precipitation per year. Moisture losses by evaporation exceed precipitation. Xerophytic plants (which have adaptations such as deep roots, small leaves or needles, or thick, waxy leaves to reduce transpiration and conserve moisture) dominate the rocky or sandy soils which lack humus. Steppes average about twice as much precipitation as deserts and support more plant life. Short grasses are the dominant vegetation, creating fertile soils that are rich in humus (decaying plant material). Livestock are often grazed in these grasslands.
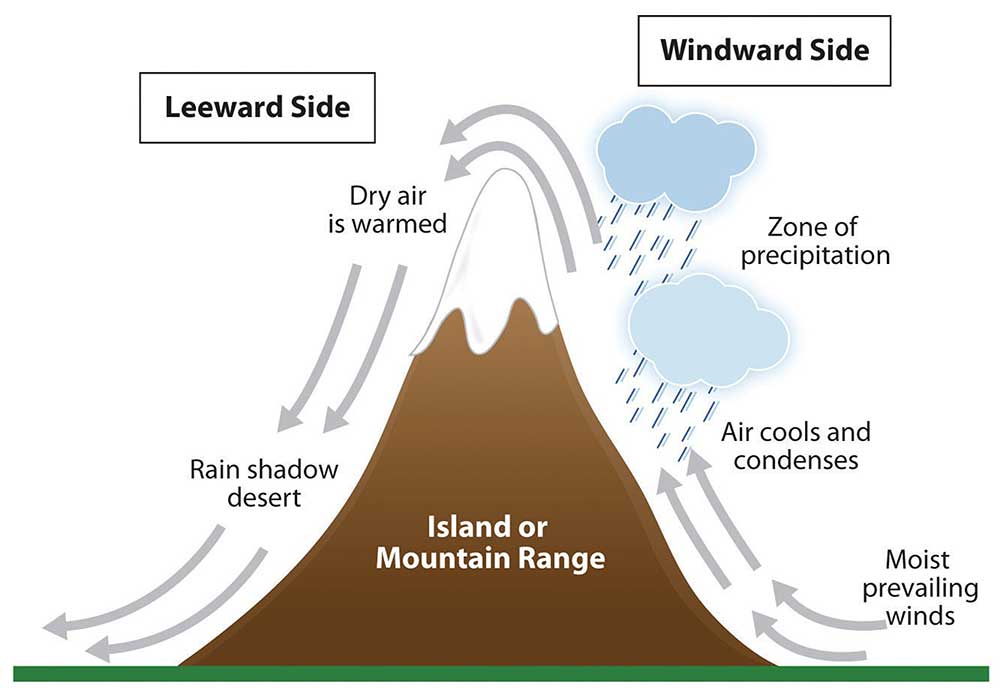
There is a direct relationship between highlands and type B climates in various places in the world. This condition, known as the rain shadow effect, occurs when one side of a mountain range (the windward side, or side facing the wind) receives abundant precipitation while the region on the other side of the mountain range (the leeward, or downwind side) is a desert or has more arid climate conditions. This phenomenon is evident wherever there is terrain with enough elevation to force air to rise, where it cools causing water vapor to condense and form clouds which may then drop precipitation.
The Hawaiian island of Kauai has an extreme example of the rain shadow effect. The island’s windward (eastern) side receives more rain than almost any other place on Earth: as much as 460 inches (almost 40 feet!) a year. Only a part of the island, however, receives that amount of rain. The height of the mountains causes a rain shadow on the leeward (western) side, creating semi-desert conditions and type B climates.
Death Valley in California is also an example of the rain shadow effect. Little rain falls on Death Valley because most moisture in the prevailing westerly winds falls on the western side of the coastal mountains and Sierra Nevada. This leaves the leeward eastern side dry, including not only Death Valley, but the entire state of Nevada.
Note that since California and Nevada are in the midlatitudes, winds are generally moving from west to east, so the rain shadow is on the eastern side of the mountains. In Hawaii and other tropical regions, winds generally blow from east to west, so the rain shadow is on the western side. In both cases, however, the rain shadow is on the downwind, or leeward, side of the mountains.

Type C: Moderate or Temperate (Mild Midlatitude) Climates
Often described as moderate in temperature and precipitation, type C climates are the most favorable to human habitation and therefore host the largest human population densities on the planet. Humans inhabit these areas because of the abundance of forests, farmland, and fresh water found in type C climate regions.
Type C climates are found mostly in the midlatitudes bordering the tropics. Seasonal changes are pronounced, with distinct winters and summers. Winters are cool to cold and summers are usually warm. Precipitation varies from low to high, depending on location.

Type D: Cold or Continental (Severe Midlatitude) Climates
Type D climate regions are often found in the interiors of continents away from the moderating influence of large bodies of water. They are usually farther north than type C regions, resulting in colder winters. Seasonal variations exist, with cool to hot summers and cold winters. Precipitation is usually in the form of rain in summer and snow in winter. Regions with type D climates can be found in the Great Lakes region of the United States, much of Canada, and a large portion of Russia. Due to the virtual absence of land at these latitudes in the southern hemisphere, type D climates are only found in the northern hemisphere.

Type E: Polar Climates
Type E is an extreme climate type found in the polar regions near or to the north of the Arctic Circle and near or to the south of the Antarctic Circle. Regions with type E climates are cold with permanent ice or permafrost (permanently frozen ground). Vegetation is minimal, and there are no trees. Temperatures may warm slightly during the short summer months but rarely rise above 50 degrees. The two polar climates are tundra and ice cap. Tundra is dominated by low-growing vegetation (dwarf shrubs, grasses, mosses, and lichens) and is mostly found in extreme northern locations bordering the Arctic Ocean, such as northern Alaska, Canada, and Russia. Ice cap mostly occurs in the interior of Greenland and Antarctica, and has no vegetation.
Type H: Undifferentiated Highland Climates
Type H highland climates are not actually a climate type. Instead, they reflect the fact that in mountainous areas, the climate may change dramatically over short distances, resulting in numerous microclimates (small areas of the same climate). Mountain ranges can create a variety of climate types because of the change in elevation from the base of the range to the summit. Different climate types can be found on the same mountain at different elevations. Climates at the base of mountains will vary depending on whether the mountains are found in the tropics or in the higher latitudes. For example, high mountains near the equator may have a type A climate at their base and a type E climate at their summit with various type C and type D climates between them. Moving up in elevation, wind speed and precipitation tend to increase, while atmospheric pressure and temperature typically decrease.
B. Environmental Concerns
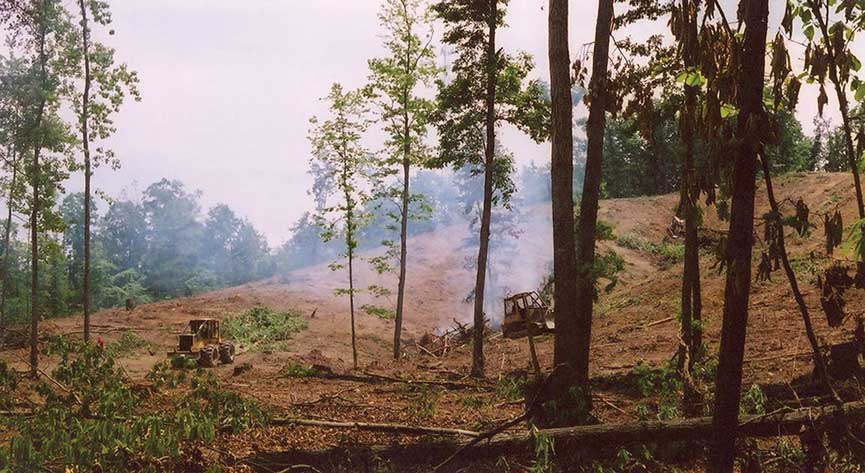
Deforestation
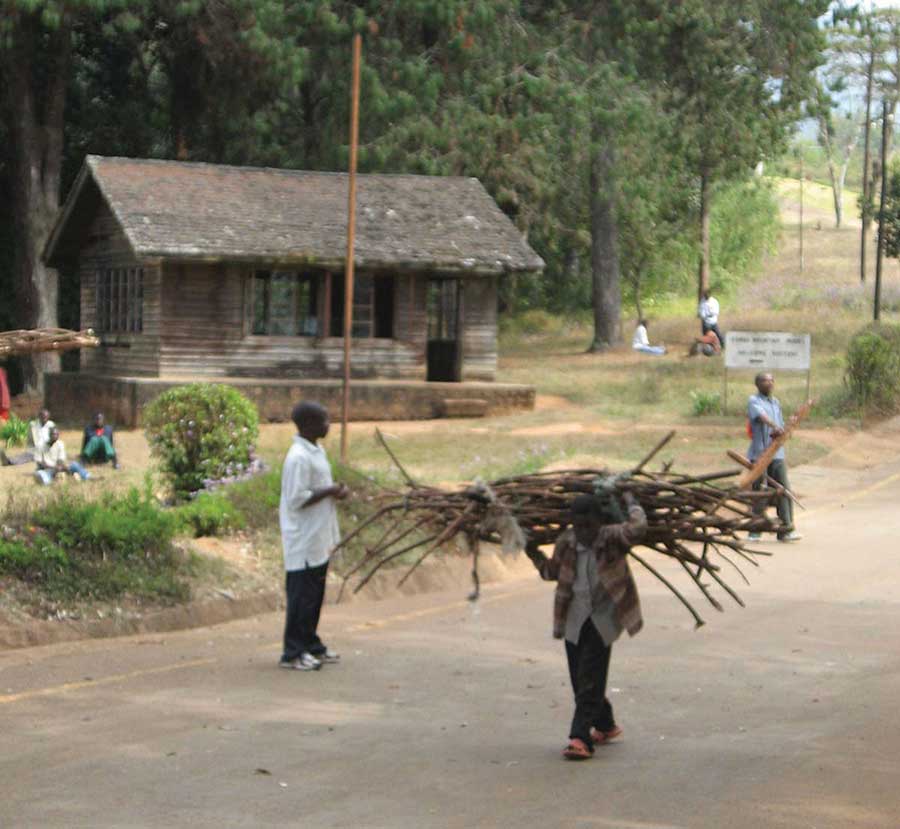
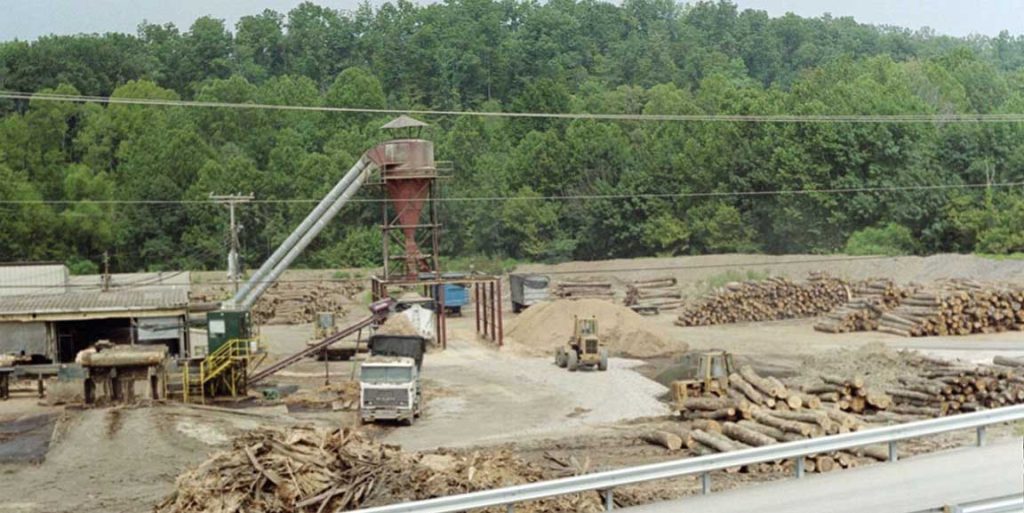
The planet’s growing population has increased demands on natural resources, including forest products. Humans have been using trees for firewood, building homes, and making tools for millennia. Trees are a renewable resource, but deforestation occurs when they are removed faster than they can be replenished. Most people in rural areas in developing countries rely on firewood to cook their food. Many of these areas are experiencing a fast decline in the number of trees available. People living in mainly type B climates may not have access to a lot of trees to start with; therefore, when trees are cut down for firewood or for building materials, deforestation occurs. In the tropical areas, it is common for hardwood trees to be cut down for lumber to gain income or to clear the land for other agricultural purposes, such as cattle ranching. Countries that lack opportunities and advantages look to exploit their natural resources—in this case, trees—for either subsistence agriculture or economic gain. Deforestation has increased across the globe with the rapid rise in worldwide population.
Countries that are better off economically no longer have to cut down their own trees but can afford to substitute other resources or import lumber from other places. Developing regions of the world in Latin America, Africa, and parts of Asia are experiencing serious problems with deforestation. Deforestation is widespread: Residents of Haiti have cut down about 99 percent of the country’s forests; most of the wood has been used as fuel to cook food. People in Afghanistan have cut down about 70 percent of their forests. Nigeria has lost about 80 percent of its old-growth forests since 1990. Ethiopia has lost up to 98 percent of its forested acreage, and the Philippines has lost about 80 percent of its forests.
Tropical rain forests only make up about 5 percent of the earth’s surface but contain up to 50 percent of the earth’s biodiversity. These forests are cut down for a variety of reasons. Norman Meyers, a British environmentalist, estimated that about 5 percent of deforestation in tropical regions is caused by the push for cattle production. Nineteen percent of these forests are cut down by the timber industry, 22 percent are cut down for the expansion of plantation agriculture, and 54 percent are removed due to slash-and-burn farming. Most tropical rain forests are located in the Amazon basin of South America, in central Africa, and in Southeast Asia. All these areas are looking for advantages and opportunities to boost their economies; unfortunately, they often target their tropical rain forests as a revenue source.
Forest ecosystems provide for a diverse community of organisms. Tropical rain forests are one of the most vibrant ecosystems on the planet. Their abundant biodiversity can provide insight into untapped solutions for the future. Plants and organisms in these habitats may hold the key to medical or biological breakthroughs, but wildlife and vegetation will be lost as deforestation eliminates their habitat and accelerates the extinction of endangered species.
Trees and plants remove carbon dioxide from the atmosphere and store it in the plant structure through the process of photosynthesis. Carbon dioxide is a major greenhouse gas that is a part of the climate change process. Carbon dioxide and other similar gases reduce the amount of long-wave radiation (heat) that escapes from the earth’s atmosphere, resulting in increased temperatures on the planet. As more carbon dioxide is emitted into the atmosphere, more warming can occur. The removal of trees through deforestation results in less carbon dioxide being removed from the atmosphere. Slash-and-burn farming methods that burn forests release the carbon in the plant life directly into the atmosphere, further increasing the climate change effect.
Climate Change
The increase in temperature in our environment has gained much attention in recent years. Questions have been raised about the rate and extent of climate change around the world. Understanding the dynamics of the temperature increase can assist in understanding how it is related to human activity.
Since the 1960s, scientists have been concerned about the concentrations of carbon dioxide, methane, nitrous oxide, and chlorofluorocarbons in the atmosphere. These so-called greenhouse gases can trap heat energy emitted from the earth’s surface and may increase global temperatures. Since the Industrial Revolution, human activity—the burning of fossil fuels and large-scale deforestation—has increased the amount of heat-trapping greenhouse gases in the atmosphere. Carbon dioxide and similar gases act like the glass panels of a greenhouse that allow shortwave radiation from the sun to enter but do not allow the long-wave radiation of heat to escape into space.
An increase in carbon dioxide and greenhouse gases in the atmosphere will normally cause an increase in the temperature, which in turn may cause changes in weather conditions in various places on Earth. Temperature changes may affect precipitation patterns and alter weather patterns, which may affect agricultural outputs and influence energy needs that can create increasing economic instability. Changes in climate also impact environmental conditions for organisms adapted to specific habitat ranges. When climates change, an organism’s habitable zone may also change, which in turn can impact entire ecosystems.
Deforestation and the burning of fossil fuels can contribute to climate change. Fossil fuels such as coal, oil, and natural gas are created when dead plant and animal life are under pressure, decay for long periods, and retain their carbon component. Burning fossil fuels releases the carbon back into the atmosphere. The increasing need for energy and lumber by human activity may continue to contribute to climate change unless alternatives can be found. The increase in temperatures may result in melting of the ice caps, which in turn may raise sea levels, impacting human activity around the world.
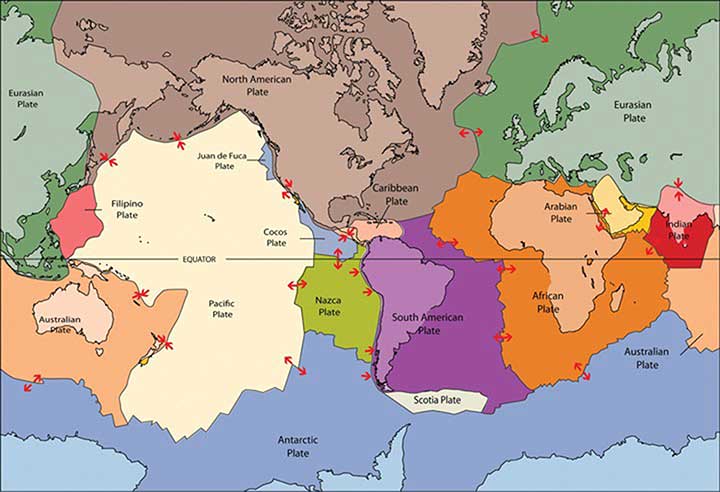
C. Geologic Processes
The movement of tectonic plates is another aspect of the earth’s dynamics that affects human activity. The earth’s crust, which is between 10 and 125 miles thick, is not one big solid chunk but rather a series of plates that cover a molten iron core at the center of the planet. The plates that cover the earth’s surface slowly shift and move. Plates can slide away from each other or they can collide, and they can slide parallel to each other in opposite directions. When two plates collide and one plate slides under an adjacent plate, the process is called subduction. Movement or shift where two plates meet can cause earthquakes and is usually associated with volcanic activity.
Mountain chains, such as the Himalayas, are a direct result of two plates colliding. The collision pushes up the earth into a mountain chain, either by direct pressure or by volcanic activity. Plates can move up to an inch a year in active regions. Driven by the earth’s internal heat, these plates have created many of the planet’s mountain landscapes. Earthquakes and volcanic action along plate boundaries continue to affect human activity and can cause serious economic damage to a community. Plate boundaries can be found near the edges of many continents. The continuous action of the plates sometimes causes serious earthquakes and volcanic eruptions that can devastate human activities. Undersea earthquakes sometimes trigger tsunamis that can bring destruction to coastal regions in their path. The earthquake off the east coast of Japan in 2011 created a tsunami that brought additional destruction to nuclear energy facilities, exposing parts of Japan and the rest of the world to radiation.
Key Takeaways
- Human activity on the planet correlates with the type of climate and terrain that presents itself to humans in the form of natural resources or habitability. Five basic climate zones (A, B, C, D, and E) describe the earth’s climate types. Temperature and precipitation are the two main variables that define a climate zone and its corresponding environmental attributes.
- The earth’s crust consists of a number of separate plates that move, creating earthquakes and volcanic activity. Most mountain ranges on Earth are a product of tectonic plate activity.
- Removing trees faster than they can grow back is called deforestation. Humans are cutting down the forests in many areas at an unsustainable rate. Deforestation can result in soil erosion, changes in weather patterns, and the loss of habitats. Trees are being cut down for firewood, building materials, or to clear land for other activities.
- Mountains can force air to rise and cause precipitation to fall on the windward side. The leeward side of the mountain range receives much less precipitation, creating an arid rain shadow.
- Climate change is a phenomenon whereby gases such as carbon dioxide and methane increase in the atmosphere and restrict long-wave radiation from escaping the planet, which can result in warmer temperatures on Earth. Trees remove carbon dioxide from the atmosphere, which may reduce climate change.
1.3 Population and Culture
Learning Objectives
- Explain the demographic transition process. Understand the con-
cept of carrying capacity as it relates to the planet’s human population. - Outline the relationship between urbanization and family size. Show how rural-to-urban shift relates to industrialization and the change in rural populations.
- Interpret a population pyramid and determine if the population is increasing or declining and if the pace of growth is intensifying or slowing.
- Distinguish between the concepts of culture and ethnicity as these terms are used in this textbook.
- Understand the difficulty in determining the number of languages and religions existing on Earth. Name the main language families and the world’s major religions.
A. Demographic Transition
Demography is the study of how human populations change over time and space. It is a branch of human geography related to population geography, which is the examination of the spatial distribution of human populations. Geographers study how populations grow and migrate, how people are distributed around the world, and how these distributions change over time.
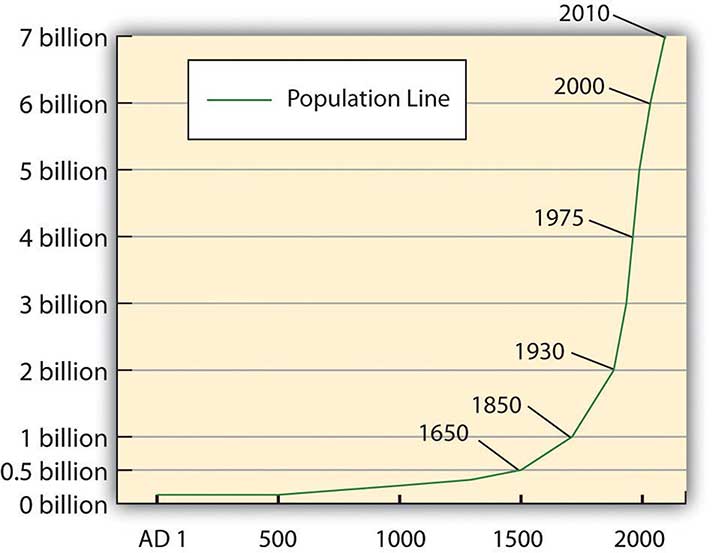
For most of human history, relatively few people lived on Earth, and world population grew slowly. Only about five hundred million people lived on the entire planet in 1650 (that’s less than half India’s population in 2000). Things changed dramatically during Europe’s Industrial Revolution in the late 1700s and into the 1800s, when declining death rates due to improved nutrition and sanitation allowed more people to survive to adulthood and reproduce. The population of Europe grew rapidly. However, by the middle of the twentieth century, birth rates in developed countries declined, as children had become an economic liability rather than an economic asset to families. Fewer families worked in agriculture, more families lived in urban areas, and women delayed the age of marriage to pursue education, resulting in a decline in family size and a slowing of population growth. In some countries today (e.g., Russia and Japan), population is actually in decline, and the average age in developed countries has been rising for decades. The process just described is called the demographic transition.
At the beginning of the twentieth century, the world’s population was about 1.6 billion. One hundred years later, there were roughly six billion people in the world, and as of 2017, the estimate is now over 7.4 billion. This rapid growth occurred as the demographic transition spread from developed countries to the rest of the world. During the twentieth century, death rates due to disease and malnutrition decreased in nearly every corner of the globe. In developing countries with agricultural societies, however, birth rates remained high. Low death rates and high birth rates resulted in rapid population growth. Meanwhile, birth rates—and family size—have also been declining in most developing countries as people leave agricultural professions and move to urban areas. This means that population growth rates—while still higher in the developing world than in the developed world—are declining. Although the exact figures are unknown, demographers expect the world’s population to stabilize by around 2100 and then decline somewhat.
In 2017, the world’s population is growing at the rate of about 1.2 percent per year, or about 90 million people per year, with that growth found almost exclusively in developing countries, as populations are stable or in decline in places such as Europe and North America. World population increase is pronounced on the continent of Asia: China and India are the most populous countries in the world, each with more than a billion people, and Pakistan is an emerging population giant with a high rate of population growth. The three largest population clusters in the world currently are the regions of east Asia, south Asia, and Europe, followed closely by southeast Asia. The continent of Africa, however, has the highest fertility rates in the world, with countries such as Nigeria—Africa’s most populous and the world’s eighth most populous country—growing rapidly each year.
The most striking paradox within population studies is that while there has been a marked decline in fertility (declining family size) in developing countries, the world’s population will grow substantially by 2030 because of the compounding effect of the large number of people already in the world—that is, even though population growth rates are in decline in many countries, the population is still growing. A small growth rate on a large base population still results in the birth of many millions of people.
Providing food, energy, and materials for these additional humans will tax many countries of the world, and poverty, malnutrition, and disease are expected to increase in regions with poor sanitation, limited clean water, and lack of economic resources. In 2010, more than two billion people (one-third of the planet’s population) lived in abject poverty and earned less than the equivalent of two US dollars per day. The carrying capacity of the planet (the number of people it can sustainably support) is not and cannot be known, but there is the possibility that we have already reached the threshold of the earth’s carrying capacity.
Population growth exacts a toll on the earth as more people use more environmental resources. The resources most immediately affected by increased populations include forests (a fuel resource and a source of building material), fresh water supplies, and agricultural soils. These systems get overtaxed, and their depletion has serious consequences. Type C climates, which are moderate and temperate, are usually the most productive and are already vulnerable to serious deforestation, water pollution, and soil erosion. Maintaining adequate food supplies will be critical to supporting a sustainable population.
B. Urbanization and Family Size
As countries move from an agricultural to an industrial economy, there is a major shift in population from rural to urban settings. The Industrial Revolution of the nineteenth century ushered in major technological developments and changes in labor practices, which encouraged migration from the farm to the city. Because of increased mechanization, fewer farm workers were needed to produce larger agricultural yields. At the same time, factories in urban areas had a great need for industrial workers. This shift continued into the information age of the late twentieth century and continues in many parts of the developing world in the current century.
A basic principle of population growth that addresses this rural-to-urban shift states that as countries industrialize and urbanize, family size typically decreases and incomes traditionally increase. Though this may not be true in all cases, it is a general principle that is consistent across cultural lines. Agricultural regions generally have a larger average family size than that of their city counterparts. Fertility rate is the average number of children a woman in a particular country has in her lifetime, whether or not they all live to adulthood. If a fertility rate for a given country is less than 2.1—the replacement level in developed countries—the population of that country is in decline, unless there is significant immigration. A fertility rate greater than 2.1 indicates that the country’s population is increasing. Some children will never reach reproductive age nor have children of their own, so the replacement rate has to be slightly greater than 2. In developing countries with high infant mortality rates, the replacement level may be as high as 2.5 or more. The concept of fertility rate is slightly different from the term family size, which indicates the number of living children raised by a parent or parents in the same household. In this textbook, family size is used to illustrate the concept of population growth and decline.
C. Population Demands
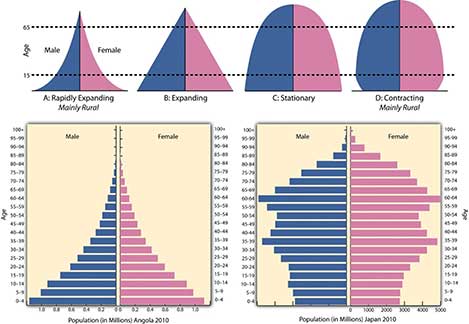
A country’s demographic statistics can be illustrated graphically by a population pyramid (also called an age-sex diagram). A population pyramid is essentially two bar graphs that depict male and female age cohorts either in absolute size or as a percentage of the total population. Male cohorts are typically shown on the left side of the pyramid, and females are on the right side.
The shape of a country’s population pyramid tells a story about the history of its population growth. For example, a high-growth-rate country has a pyramid that is narrow at the top and wide at the bottom, showing that every year more children have been born than the year before. As family size decreases and women in a society have fewer children, the shape of the pyramid changes. A population pyramid for a postindustrial country that has negative growth would be narrower at the bottom than in the middle, indicating that there are fewer children than middle-aged people. Four basic shapes indicate the general trends in population growth:
- Rapidly expanding
- Expanding
- Stationary
- Contracting
These shapes also illustrate the percentage of a population under the age of fifteen or over the age of sixty-five, which are standard indicators of population growth. Many postindustrial countries have a negative population growth rate. Their population pyramids are narrow at the bottom, indicating an urbanized population with small family sizes.
D. Culture and Ethnicity
The term culture is often difficult to differentiate from the term ethnicity. In this textbook, ethnicity indicates traits people are born with, including genetic backgrounds, physical features, or birthplaces. People have little choice in matters of ethnicity. The term culture indicates what people learn after they are born, including language, religion, and customs or traditions. Individuals can change matters of culture by individual choice after they are born. These two terms help us identify human patterns and understand a country’s driving forces.
The terms culture and ethnicity might also be confused in the issue of ethnic cleansing, which refers to the killing or forced removal of a people from their homeland by a stronger force of a different people. Ethnic cleansing might truly indicate two distinct ethnic groups: one driving the other out of their homeland and taking it over. On the other hand, ethnic cleansing might also be technically cultural cleansing if both the aggressor and the group driven out are of the same ethnic stock but hold different cultural values, such as religion or language. The term ethnic cleansing has been used to describe either case.
E. Languages of the World
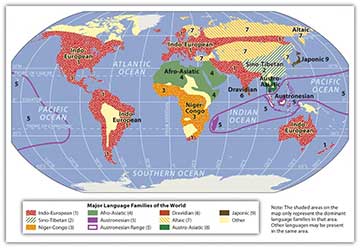
Of the more than 6,000 languages, about a dozen are spoken by more than one hundred million people each. These are the world’s main languages used in the most populous countries. However, the vast majority of the world’s languages are spoken by a relatively small number of people. In fact, many languages have no written form and are spoken by declining numbers of people. Language experts estimate that up to half the world’s living languages could be lost by the end of the twenty-first century as a result of globalization. New languages form when populations live in isolation, and in the current era, as the world’s populations are increasingly interacting with each other, languages are being abandoned and their speakers are switching to more useful tongues.
There are nine dominant language families in the world. Each of the languages within a language family shares a common ancestral language. An example of a language family is the Indo-European family, which has a number of branches of language groups that come from the same base: a language called Proto-Indo-European that was probably spoken about six thousand years ago. As populations migrated away from the ancestral homeland, their language evolved and separated into many new languages. The three largest language groups of the Indo-European family used in Europe are the Germanic, Romance, and Slavic groups. Other Indo-European languages include Hindi (spoken in India) and Persian (spoken in Iran).
Language Characteristics
The following terms are used to describe language characteristics:
- Creole. Similar to pidgin, a Creole language arises from contact between two other languages and has features of both. However, Creole is a pidgin that becomes a primary language spoken by people at home. Creole languages are often developed in colonial settings as a dialect of the colonial language (usually French or English). For example, in the former French colony of Haiti, a French-based Creole language was developed that is spoken by people at home, while French is typically used for professional purposes.
- Dialect. A dialect is a regional variety of a language that uses different grammar or pronunciation. Examples include American English versus British English. Linguists suggest that there are three main dialects of the English language in the United States: a Southern dialect, a midland dialect, and a Northern dialect. Television and public media communication have brought a focus on more uniform speech patterns that have diminished the differences between these three dialects.
- Isolated language. An isolated language is one not connected to any other language on Earth. For example, Basque is not connected to any other language and is only spoken in the region of the Pyrenees between Spain and France.
- Lingua franca. A lingua franca is a second language used for commercial purposes with others outside a language group but not used in personal lives. For example, Swahili is used by millions in Africa for doing business with people outside their own group but is not used to communicate within local communities.
- Official language. The official language is the language that is on record by a country to be used for all its official government purposes. For example, in India the official language is Hindi, though in many places the lingua franca is English and several local languages may be spoken.
- Pidgin. A pidgin is a simplified, created language used to communicate between two or more groups that do not have a language in common. For example, Residents of New Guinea mix English words with their own language to create a new language that can bridge speakers of different local language groups. Though the words are in English, the grammar and sentence structure is mixed up according to local vocabulary. There are many English-based pidgin languages around the world.
F. Religions of the World
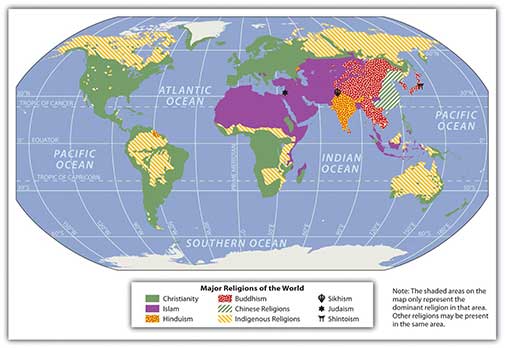
Religious geography is the study of the distribution of religions and their relationship to their place of origin. Cultural geographers recognize three main types of religions: universal (or universalizing), ethnic (or cultural), and tribal (or traditional) religions. Universal religions include Christianity, Islam, and various forms of Buddhism. These religions attempt to gain worldwide acceptance and appeal to all types of people, and they actively look for new members, or converts. Ethnic religions appeal to a single ethnic group or culture. These religions do not actively seek out converts. Broader ethnic religions include Judaism, Shintoism, Hinduism, and Chinese religions that embrace Confucianism and Taoism. Finally, traditional religions involve the belief in some form of supernatural power that people can appeal to for help, including ancestor worship and the belief in spirits that live in various aspects of nature, such as trees, mountaintops, and streams (this is often called animism). Sub-Saharan Africa is home to many traditional religions.
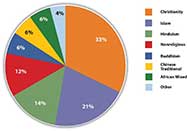
Although the world’s primary religions are listed here, many other religions are practiced around the world, as well as many variations of the religions outlined here. The top four religions by number of adherents are Christianity, Islam, Hinduism, and Buddhism. Because the official doctrine of Communism was nonreligious or atheist, there are actually many more followers of Buddhism in China than demographic listings indicate. The percentage of the world’s population that follows Buddhism is probably much higher than the 6 percent often listed for this religion.
- Christianity and Islam originated out of Judaism in the eastern Mediterranean and the Arabian Peninsula. Both are monotheistic religions that look to the Jewish patriarch Abraham as a founding personage. Christianity, based on the life and teachings of Jesus Christ, who lived in Palestine in the first century CE, spread rapidly through the Roman Empire. Islam is based on the teachings of Muhammad, a seventh-century religious and political figure who lived on the Arabian Peninsula. Islam spread rapidly across North Africa, east across southern Asia, and north to Europe in the centuries after Muhammad’s death.
- Buddhism is a religion or way of life based on the teachings and life of Siddhartha Gautama, who lived in what is now India/Nepal around the fifth century BCE. There are three main branches of Buddhism: southern or Theravada Buddhism, eastern or Mahayana Buddhism, and northern or Vajrayana (Tibetan) Buddhism.
- Hinduism is a religious tradition that originated on the Indian subcontinent. Unlike other world religions, Hinduism has no single founder and is a conglomerate of diverse beliefs and traditions. Hinduism has a large body of scripture, including the Vedas, the Upanishads, and epic tales such as the Mahabharata and the Ramayana.
- Sikhism, a religion founded in the Punjab region of southern Asia, is a monotheistic religion centered on justice and faith. High importance is placed on the principle of equality between all people. The writings of former gurus are the basis for the religion.
- Judaism is the religion of the Jewish people, whose traditions and ethics are embodied in the Jewish religious texts, the Tanakh, and the Talmud. According to Jewish tradition, Judaism began with the covenant between God and Abraham around 2000 BCE.
- Shintoism is a major ethnic religion of Japan focused on the worship of kami, which are spirits of places, things, and processes.
- Confucianism and Taoism are ethnic Chinese religions based on morality and the teachings of religious scholars such as Confucius.
Key Takeaways
- The human population is estimated at over seven billion in 2016 and is increasing rapidly, mainly in developing regions of Asia and Africa. No one can agree on the earth’s carrying capacity for our human population, but unless the growth rate changes, the human population will double in about sixty years.
- Since the Industrial Revolution, humans have been moving from rural areas to urban areas. Workers were needed in the factories and fewer workers were needed on the farms because of improved technology. This trend is still happening in many developing countries. Population pyramids are one method of illustrating demographic data for a country to show if the population is declining or increasing and at what rate.
- Though often interchangeable in general terms, for the purpose of geography in this textbook, ethnicity is what you are born with and culture is what you learn after you are born.
- There are over six thousand individual languages in the world today, with about thirteen of them spoken by one hundred million people or more. Of the main language families, nine include at least 1 percent or more of the human population.
- There are thousands of religions or variants of them in the world. Cultural geographers recognize three main types of religions: universal, ethnic, and traditional. The four largest religions of the world are Christianity, Islam, Hinduism, and Buddhism.
1.4 Globalization and Development
Learning Objectives
- Recognize that globalization has been a human activity since the era of European colonialism and that more recent globalization has been evident in the post-Cold War era through an increase in global activ-ities by multinational corporations.
- Explain how the concepts of opportunity and advantage create a stronger rural-to-urban shift and fuel migration in various regions of the world.
- Understand the dynamics of the core-periphery spatial relationship and determine whether a country is a part of the core or periphery by its respective attributes.
- Determine how countries gain national income and which activities are renewable or have value-added profits. Understand the vital roles that labor and resources play in the economic situation for each country.
- Comprehend the patterns illustrated in the index of economic development—especially in terms of how it illustrates a country’s development status in regard to family size and economic indicators. Learn the relationship between the concepts of rural-to-urban shift, core-periphery spatial relationships, opportunity and advantage, and haves and have-nots.
A. Globalization
Geographers and professionals in other disciplines understand that the world is not static. Cultural forces continue to act on human activities as globalization creates new alliances and global networks. The goal is to understand globalization and to make sense of what is happening. The better we understand the world and human dynamics, the better we will be prepared to address the changes that are occurring. Geography provides a means to spatially examine these changes.
Globalization is a process with a long history. People have been exploring, migrating, and trading with each other throughout human history, and these activities have created interactive networks connecting the different parts of the planet and producing dependent economic relationships. In modern times, globalization can be recognized by noting iconic global corporations, such as Wal-Mart, McDonald’s, or Toyota, that trade across international borders and integrate labor and resources from different countries to sell a product or service in the global marketplace. In a number of countries, people have protested against the building of a new Wal-Mart or McDonald’s, and such protests exemplify concerns about globalization and the growing expansion of dominant global economic units into local communities. These ubiquitous corporations represent corporate interests that are primarily concerned with company profits. Global corporations tend to view countries or communities as either markets for their products or sources of labor or raw materials. Globalization can seriously impact local communities for better or for worse, depending on local circumstances. The main force that encourages globalization is economic activity based on technological advancements. Cultural and societal changes often occur as a consequence and are no less significant.
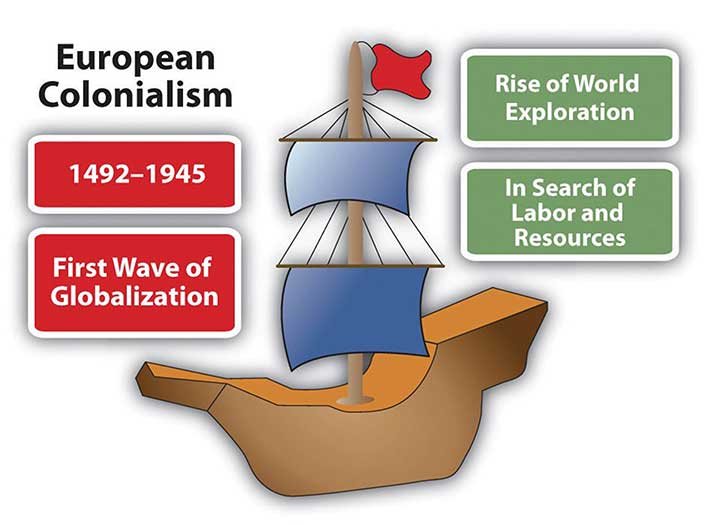
European colonialism was an early wave of globalization that changed the planet and shaped most of the world’s current political borders. This early wave of global conquest was fueled by the Industrial Revolution. Colonialism transferred technology, food products, and ideas around the globe in merchant ships that centered on the European power bases of the colonial empires of Europe—mainly Britain, Spain, France, Portugal, and the Netherlands. When the United States became independent of these European colonial powers, it began to extend its power and influence around the world. Thus the first major wave of globalization was a result of European colonialism.
The space race and the information age of the latter portion of the twentieth century initiated a second major wave of globalization. The space race was a competition between the United States and the Soviet Union to develop space-related technologies, including satellites, and to land on the moon. The end of the Cold War, with the collapse of the Soviet Union in 1991, coincided with advancements in computer technology that fueled the second major wave in modern globalization. Technology and corporate activity have stimulated a wave of globalization that is impacting the economies of countries around the world. In European colonialism, the land and people were physically conquered by the mother country and became colonies ruled by the European colonizer’s government. Great Britain was the most avid colonizer and amassed great fortunes through its colonial possessions. One difference between European colonialism and globalization today is that globally active multinational corporations do not wish to own the country or run the government directly. Corporations are not concerned with what government type is in power or who is running the country as long as they can operate and make a profit. This neocolonialism (new colonialism or corporate colonialism), like European colonialism, continues to exploit natural resources, labor, and markets for economic profits. Its critics claim that corporate colonialism is nothing more than a legal method of pillaging and plundering, and its supporters claim it is the most efficient use of labor and resources to supply the world with the lowest-priced products.
Examples of corporate colonialism can be seen in the trade relationships between the United States and places such as Mexico and China. US corporations move their manufacturing plants to Mexico to earn more profits by exploiting cheap labor. The corporations do not take over Mexico politically; they exploit it economically. The many US corporations that have started manufacturing their products in China do not attempt to overthrow the Communist Chinese government; they want to exploit the cheap Chinese labor pool and open up markets to sell products to Chinese consumers. Desire for profits drives corporate colonialism.

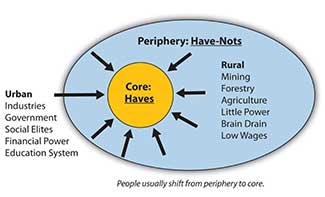
B. Core-Periphery Spatial Relationship
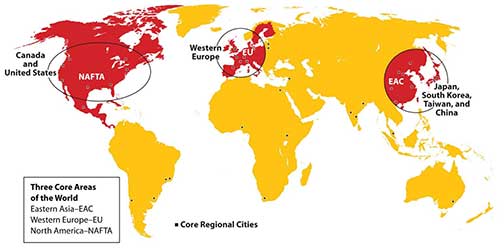
Economic conditions vary across the globe. There are wealthy countries (the so-called “haves”) and poor countries (“have-nots”), and the determination of which countries are wealthy and which countries are poor has generally been determined by the availability of economic opportunities and advantages. There are three core areas of wealthy industrialized countries, all of which are in the Northern Hemisphere: North America, Western Europe, and eastern Asia. The main market centers of these regions are New York City, London, and Tokyo. These three core areas and their prosperous neighbors make up the centers of economic activity that drive the global economy. Other wealthy countries can be found dispersed in regions with large amounts of natural resources, such as the Middle East, or places of strategic location, such as Singapore. The world’s poorer countries make up the peripheral countries. A few countries share qualities of both and may be called semi-peripheries.
The periphery countries and the core countries each have unique characteristics. Peripheral locations are providers of raw materials and agricultural products. In the periphery, more people earn their living in occupations related to securing resources: farming, mining, or harvesting forest products. For the workers in these occupations, the profits tend to be marginal with fewer opportunities to advance. In the periphery, there is a condition known as brain drain, which describes a loss of educated or professional individuals. Young people leave the peripheral areas for the cities to earn an education or to find more advantageous employment. Few of these individuals return to the periphery to share their knowledge or success with their former community.
Brain drain also happens on an international level—that is, students from periphery countries might go to college in core countries, such as the United States or countries in Europe. Many international college graduates do not return to their poorer countries of origin but instead choose to stay in the core country because of the employment opportunities. This is especially true in the medical field. There is little political power in the periphery; centers of political power are almost always located in the core areas or at least dominated by the core cities. The core areas pull in people, skills, and wealth from the periphery. Lack of opportunities in the periphery pushes people to relocate to the core.
Power, wealth, and opportunity have traditionally been centered in the core areas of the world. These locations are urbanized and industrialized and hold immense economic and political power. Ideas, technology, and cultural activity thrive in these core areas. Political power is held in the hands of movers and shakers who inhabit the core. The core depends on the periphery for raw materials, food, and cheap labor, and the periphery depends on the core for manufactured goods, services, and governmental support.
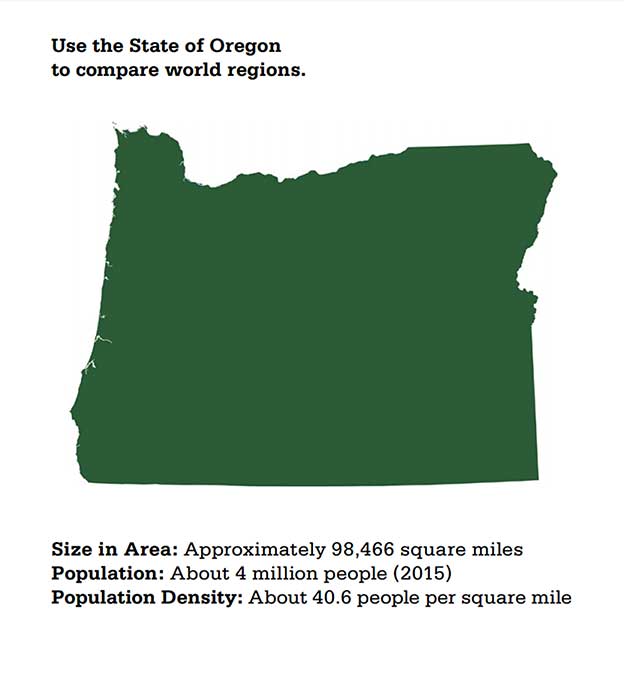
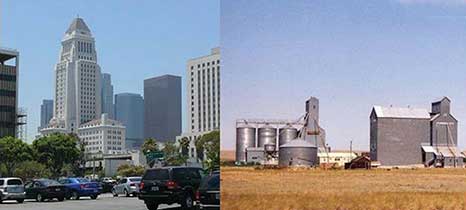
The core-periphery spatial relationship can be viewed on various levels. On a local level, consider the state of Oregon. Portland is by far the largest city, followed by Salem and Eugene to the south in the fertile Willamette Valley. This area is the core of Oregon, with about 75% of the state’s population, its largest cities, state capital, and the bulk of the state’s manufacturing and high tech industries. The rest of Oregon can be considered the periphery, and has an economy based more on farming, ranching, and timber, which is typical of a peripheral region.
If we move up a level, we can understand that entire regions of the United States can be identified as peripheral areas: the agricultural Midwest, rural Appalachia, and the mountain ranges and basins of the western United States. The large metropolitan areas of the East and West Coasts and the Industrial Belt act as the core areas. Los Angeles and New York City anchor each coast, and cities such as Chicago, St. Louis, Denver, and Indianapolis represent the heartland. All the other large cities in the United States act as core areas for their surrounding peripheral hinterlands. Southern cities such as Atlanta, Memphis, Dallas, or Phoenix act as core centers of commerce for the South in a region known as the Sun Belt.
On a global scale, we can understand why North America, Western Europe, and eastern Asia represent the three main economic core areas of the world. They all possess the most advanced technology and the greatest economic resources. Core regions control the corporate markets that energize and fuel global activity. Peripheral regions include portions of Africa, Asia, Latin America, and all the other places that primarily make their living from local resources and support the economic core. These peripheral regions may include key port cities. A semi-periphery would be a transitional area between the core and the periphery, which could include countries such as Russia, India, or Brazil that are not exactly in the core and not really in the periphery but might have qualities of both. World migration patterns follow the core-periphery spatial relationship in that people and wealth usually shift from the peripheral rural regions to the urban core regions. The “have” countries of the world are in the core regions, while the “have-not” countries are most likely in the peripheral regions.
C. Economic Sectors
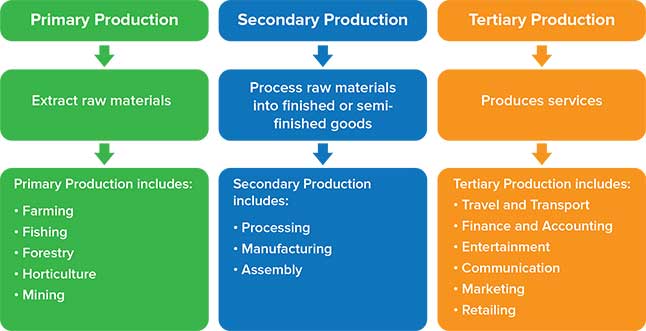
For the purpose of understanding economic geography, all economic activities can be grouped into one of four categories, each with its respective terms, depending on the nature of what is being produced:
- Primary economic sector activities include everything that pertains to the collection of raw materials, such as agriculture, forestry, fishing, and mining—in other words, growing and extracting activities.
- Secondary economic sector activities involve the processing of those raw materials through manufacturing, which has been the mainstay of economic growth for most developed countries, as well as construction.
- Tertiary economic sector activities are those that produce services, not physical products, such as wholesale and retail sales, personal services, and business services.
- Quaternary economic sector activities are those that deal with information collecting and processing, as well as management and decision-making.
The tertiary and quaternary economic sectors are often thought of together as the service sector. Only primary and secondary activities produce actual physical products, and manufacturing traditionally earns the highest value-added profits. Tertiary activities are selective in gaining national wealth. For example, service activities such as tourism can bring in national wealth if the visitors are from outside the country. Tourism within a country can also influence economic conditions by increasing the amount of consumer spending.
D. Development and Demographics
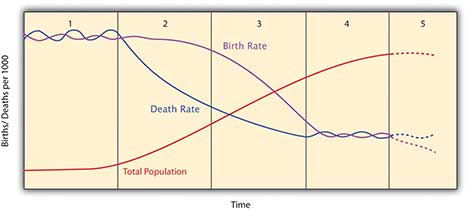
The Industrial Revolution, which prompted the shift in population from rural to urban, also encouraged market economies, which have evolved into modern consumer societies. Various theories and models have been developed over the years to help explain these changes. For example, in 1929, the American demographer Warren Thompson developed the demographic transition model (DTM) to explain population growth based on an interpretation of demographic history. A revised version of Thomson’s model outlines five stages of demographic transition, from traditional rural societies to modern urban societies:
- Stage 1: High birth and death rates; rural pre-industrial society
- Stage 2: Declining death rate; high birth rate; developing country
- Stage 3: Declining birth rate; low death rate; high urbanization rate; industrial country
- Stage 4: Low birth and death rates; stabilized population; mostly urban population
- Stage 5: Declining population; urban post-industrial society
As a general trend, when a country experiences increasing levels of industrial activity and urbanization, the outcome is usually a higher standard of living for its people. One way to define development, in fact, is simply as a process of improving the standard of living of people.
The human development index (HDI) was developed in 1990 and used by the United Nations Development Program to measure a standard of human development, which refers to the widening opportunities available to individuals for education, health care, income, and employment. The HDI incorporates variables such as standards of living, literacy rate, and life expectancy to indicate a measure of well-being or the quality of life for a specific country. The HDI is used as an indicator of a country’s economic and technological development.
Additionally, rural-to-urban shift takes place, driven by the pull of opportunities and advantages in the industrializing and urbanizing areas. Though there are exceptions, a decrease in family size usually coincides with a higher level of urbanization. There are cases in which only core regions within a country transition through the five development stages without the peripheral regions experiencing the coinciding levels of economic benefit. The five stages of the DTM assist in illustrating these general patterns.
Stage 1 of the DTM indicates traditional rural societies, which are usually based on agriculture and not as dependent on the outside world. Stage 1 families are larger, their income levels are low, and their advantages and economic development opportunities are low. Health care, education, and social services are in short supply or nonexistent. High birth and death rates maintain a high fertility rate/family size and a low population-growth status. Populations in stage 1 development have a stationary population pyramid. Though there may be small, remote regions of the world that exhibit stage 1 development patterns, no countries fall into this category any longer.
Stage 2 countries experience high population growth rates because family size remains high but modern medicine or improved nutrition allows people to live longer, which lowers the death rate. Population is exploding in countries in stage 2. During this stage, young people from rural areas often migrate to the cities looking for employment. Rural stage 2 regions are starting to urbanize and integrate their economic activities with the outside world. Regions in stage 2 often have a surplus of cheap labor. Income levels remain low and family size continues to be large. Countries in this stage often have a rapidly expanding population pyramid with a very wide base.
Societies that have made business connections that provide for manufacturing of products, industrial activities, or an increased service sector might progress to stage 3, the rural-to-urban shift stage. These regions are experiencing a high rate of rural-to-urban shift in their populations. These regions are often targeted by multinational corporations for their labor supply, and as people migrate from rural areas to the cities looking for employment, urban populations grow and core or central cities experience high rates of self-constructed housing (slums). Income levels start to increase and family size starts to drop significantly. Stage 3 countries still have an expanding population, but the rate of population growth is slowing as birth rates drop.
Societies that have urbanized and industrialized and are members of the global marketplace might enter
stage 4. Members of an urban workforce assist in building a networked economy. Family size is lower as urban women enter the workforce and have fewer children. Health care, education, and social services become increasingly available, and income levels continue to rise. In stage 4, there is typically a high level of growth in the industrial and service sectors with a great need for infrastructure in the form of transportation, housing, and human services. Countries in stage 4 have populations that resemble a stationary population pyramid.
As incomes increase and family size decreases, a consumer society emerges, creating stage 5, where high mass consumption can drive the economy. Countries in stage 5 experience a negative population growth rate in which the fertility rate (family size) is below replacement levels. With a low number of young people entering the workforce, stage 5 regions become an attractive magnet for people looking for opportunities and advantages in the job market. Illegal immigration might become an issue. Many countries in Europe are now experiencing this condition. Populations in stage 5 development have a contracting population pyramid with a narrow base.
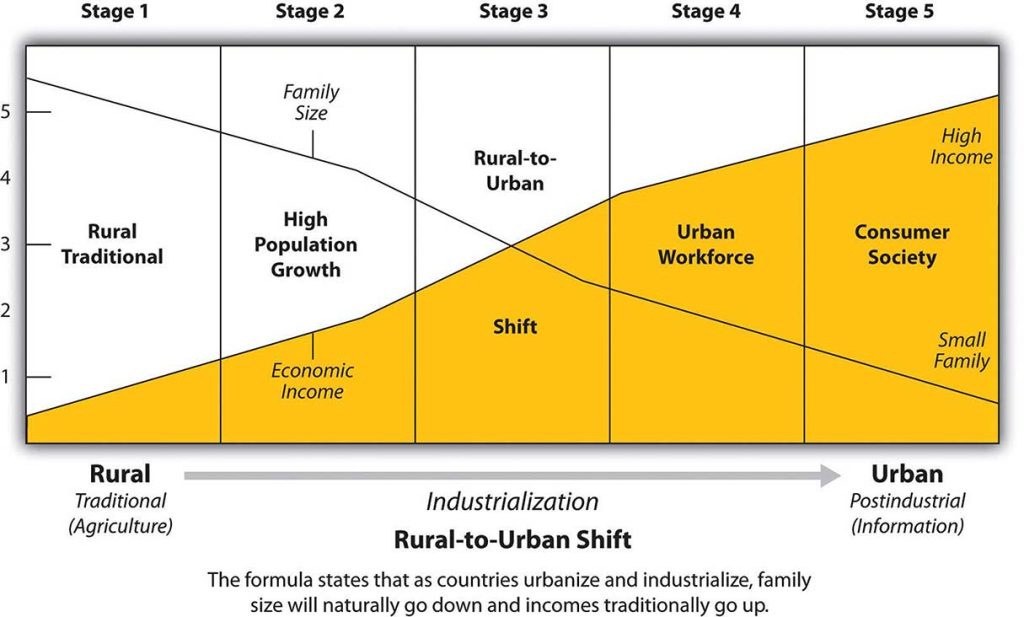
E. Geography of Opportunity
Highly industrialized countries in Western Europe, eastern Asia, or North America can offer more economic opportunities compared with developing countries. The push-pull factors that push people out of poorer countries and pull them to an industrialized country are strong. Portions of the population of countries in the earlier stages of the demographic transition often migrate to countries in the latter stages looking for work and other opportunities. People who do not have opportunities often want to move to places that do have them so they can work to attain greater economic security for themselves and their families.
Countries in stage 4 or 5 of the DTM are often attractive places for those seeking greater economic opportunities. Populations in these stages generally have fewer children, so the demand for entry-level workers is often higher. Immigrants with fewer skills take the entry-level jobs to enter the economic workforce. An established country with a long-standing history and culture does not always welcome an influx of new immigrants, however. The arrival of an immigrant labor pool often includes individuals who hold different cultural traditions or customs than those of the mainstream society. Social tensions may arise if different ethnic groups are vying for the same cultural spaces and opportunities. One example is the large number of people entering the United States across its southern border. Europe is experiencing a similar immigration issue, with immigrants from North Africa, the Middle East, and former colonies. Japan, on the other hand, has taken pride in holding on to its homogeneous Japanese culture, but it is facing the same employment situation.
Key Takeaways
- The search for cheap labor and resources drives the need for profits by multinational corporations that fuel the global economy. This activity is creating a second major wave of globalization, often referred to as neocolonialism or corporate colonialism.
- The concepts of opportunity and advantage provide a means to understand the attractiveness or unattractiveness of a place to immigrants or economic activities. Opportunities and advantages drive rural-to-urban shift, migration, and movement of corporate activity.
- Core areas are usually urban with high levels of industrial and economic development. Peripheral areas are typically suppliers of food and raw materials used in the core. Political and economic power is held in the core, while the periphery suffers from lower incomes and brain drain.
- Economic activities can be grouped into one of four economic sectors: primary (extractive); secondary (processing and manufacturing); tertiary (sales and personal and business services); and quaternary (data collecting and processing and decision-making). In more developed countries, most workers are employed in services (the tertiary and quaternary sectors), although the primary and secondary sectors may contribute more to national income.
- Development and population models can help one understand a country’s socioeconomic dynamics. Family size and economic income are two indicators that can be tracked to assist in understanding the industrialization or urbanization levels of a country or demographic region.
- Globalization has prompted a greater understanding of how opportunities and advantages relate to haves and have-nots. Whether it is individuals or countries, some have greater levels of opportunity and advantage than others. Human migration patterns usually coincide with the push-pull forces of opportunity or advantage levels.
- Many of the concepts used to understand the dynamics of a region or place are related. The four main types of population pyramids can help illustrate the various stages of a country’s socioeconomic situation as illustrated in the demographic transition model (DTM).
End-of-Chapter Summary
- Geography is the spatial study of the earth’s surface. The dynamic discipline of geography bridges the social sciences and the physical sciences. Geography’s spatial nature can be illustrated by the creation of maps as an important means of communicating information. Human geography and physical geography are the two main fields of the discipline. GPS, GIS, and remote sensing are tools geographers use to spatially study a location or the physical or cultural landscape.
- Geographers divide the earth into a grid to provide location references to places on its surface. Human activity is orientated around the grid system to provide time zones, navigation, and the organization of communication systems. Climate and seasonal changes can be tracked using this grid system of latitude and longitude.
- Regions are the basic units of geographic study. World geography divides the world into sets of regions called realms that are used as comparison studies regarding human and physical landscapes and activities. Climate regions or zones are helpful in understanding the earth’s environmental conditions. Historically, human activity has been strongly affected by the variation in climates. Type C climates have generally attracted large human populations.
- The relationship between the environment and human activity is an important component of geography. The movement of tectonic plates sometimes causes earthquakes and volcanic activity, which affects human activity. The rain shadow effect can also impact where and how humans live. Human activity contributes to environmental problems such as deforestation, which impacts the environment through the loss of habitats, soil erosion, and possibly climate change.
- The human population continues to increase. The earth’s carrying capacity for humans is debatable, but the impact that humans have on the planet is undeniably extensive. Some factors and conditions encourage high population growth, while others discourage population growth. Migration, rural-to-urban shift, and urbanization are related to changes in population. As population increases, the number of languages continues to decrease—an example of the impact of globalization.
- European colonialism created a major wave of globalization that extended up until about the time of World War II. After the Cold War ended, a second wave of globalization was fueled by the information age and the introduction of new communication and transportation technologies. Concepts such as labor and resources, opportunity and advantage, or haves and have-nots can help explain the dynamics of globalization.
- The core-periphery spatial relationship helps explain how human economic activity is organized around either an urban core or a rural periphery. The methods countries use to gain national income are a means to understand the ways in which economic activity is categorized and explained. The demographic transition model (DTM) is a model relating to the stages a country may transition through to reach a postindustrial development level. All these concepts, models, and theories are tools used to understand the human activities that are elements of the globalization process.